Lars and I are talking on twitter at the moment about a construct which would better define the diversity and generation of brewing traditions than style. The style construct is prone to too many weaknesses, such as:
a. artificiality: a style is what is accepted to be a style as opposed to when one asserts itself as one and operates best only in the last 40 years since its early first steps,
b. lack of relative scale: each style is presented as an equal,
c. independence: style lack the key expression of chronological dependency and contemporary cross-influence, and
d. over distinction: styles present themselves as being too separate, ignores the normal sort of overlap and blurred lines.
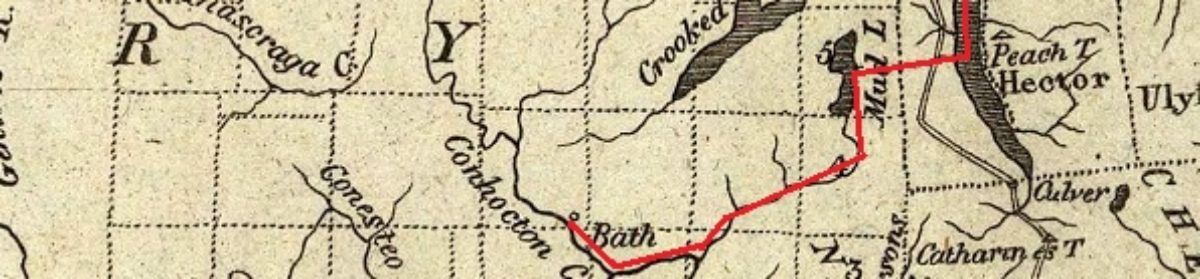
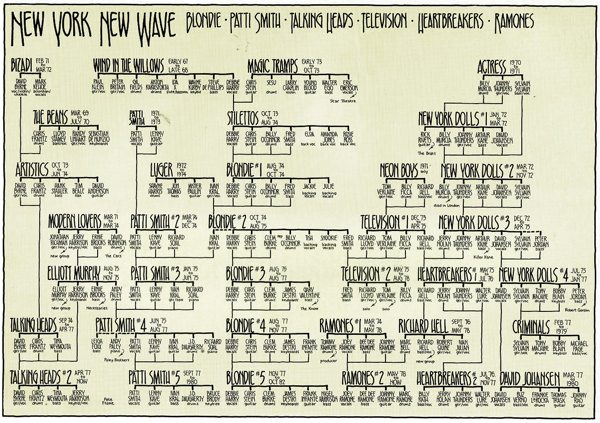
Could a tree diagram better express the organic aspects of brewing? Think of those rock family tree posters or a chart setting out a linguistic tree. Could such a construct better describe the dynamic nature of brewing history? I was playing with the idea of a poster based on a Gantt chart for the histories of breweries in a specific region, like perhaps this handy spiral version describing geological time but that doesn’t seem reasonable above a certain scale. The tree would express time on the X access, diversity on the Y. Ideally, like Google maps, one could drill down into it to find finer levels of relationship or draw back to higher levels of abstraction.
These need not replace style but could go some way to break its tyranny or at least give it context and competition.
I think the trick is that beer styles are for consumers, not producers or researchers.
Serious intellectual rumination on the production of beer does better to ignore “styles” as the BJCP defines them entirely, a few conflations notwithstanding.
Stan linked to a very basic example: https://twitter.com/StanHieronymus/status/814479071258284033
I guess the question is what do you really want to map on the tree–physical characteristics of beer (color, abv, IBU, etc.), taste characteristics (maltiness, hopiness, type of hop aroma/flavor, etc.), ingredients (particular hops, malts, yeasts), techniques (lagering, dry-hopping, etc.), or some combination of those, or something else altogether? It gets complicated with cross-pollination of ideas and ingredients across brews, too.
Maybe a tree isn’t the best way to represent this? Perhaps a pie chart through time showing particular characteristics of each general beer variety at a point in time? Or a scatter plot? I dunno…perhaps there is inspiration in the books of Edward Tufte?
I was recently thinking about ways to plot the morphospace of beer (morphospace=shapes represented in a particular organism–it’s fairly common in my field of paleontology, where you might want to plot how skull shapes vary in dinosaurs, for instance). A sufficiently large recipe database, after running through the appropriate statistical analysis, could be used to plot various beers and how they compare to each other. It could even be “style-free”–all you need to know are the ingredients, not the style. Given enough time slices for recipes, you could map out how the beer varieties changed over time. Not sure if this makes sense (it’s a lot easier to explain with a white board), but there you have it.
Nothing to do with the experience of drinking the beer at all. Just the history as in location, time and relative scale of production compared to other sorts of beer.
But you are right on about Tufty. I need to pull out my book of his and have a think.
Tufte: http://abetterbeerblog427.com/2012/04/25/887/
Yes, the Napoleonic march chart referenced in your post was exactly the one I was thinking of! You wouldn’t necessarily have to do it geographically, either–it could be simple chronological, with various arrows and streams parting and converging. Geography would be a neat trick if you could manage it, though.
An idea whose time is blooming? Research into developing flavor ‘trees’: http://www.npr.org/sections/thesalt/2016/12/30/506144786/one-mans-quest-to-reinvent-the-wheel-the-flavor-wheel-that-is
I was interested in the rock family tree but the link is the same as the linguistic tree (which is very interesting, but I wonder where Finnish fits).
Lemme check… FIXED!